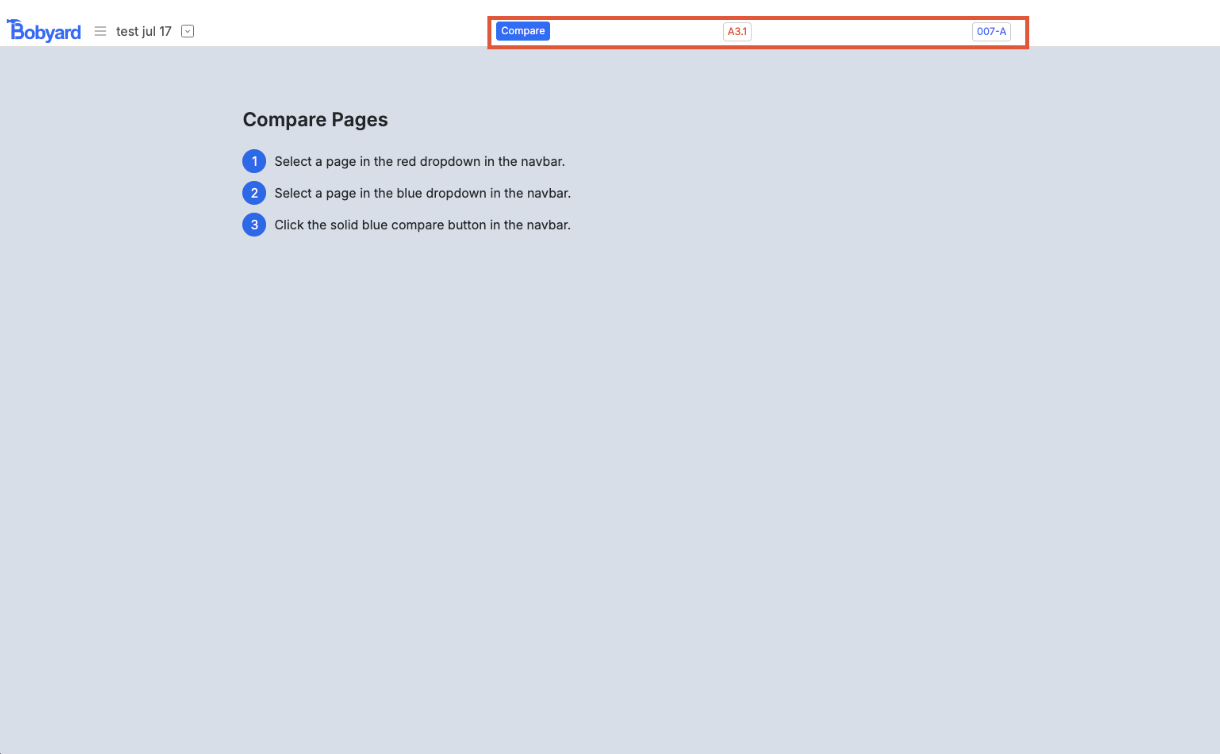
Compare pages
In the navbar of the project files page, you can access the compare pages tool.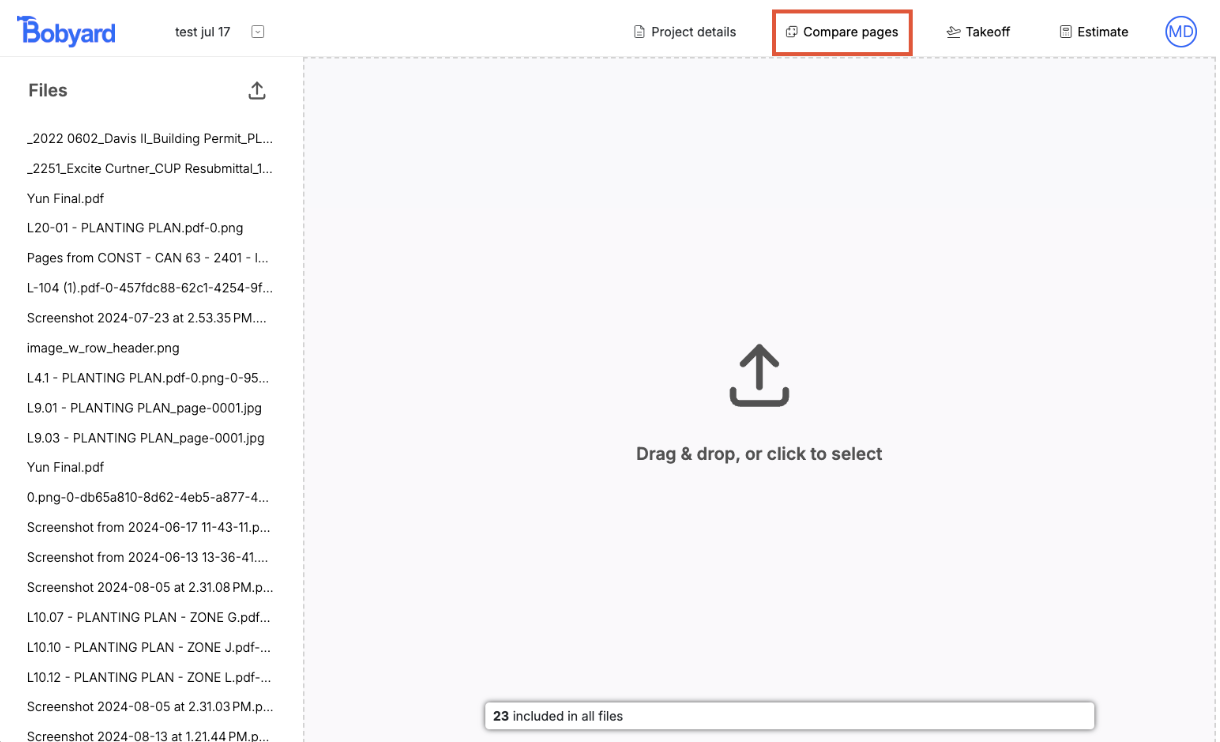
Takeoff settings
By clicking on your profile in the top right on any of the pages, you are taken to the profile/settings pages for Bobyard. There is a tab on the left for ‘settings.’ This is where you can toggle on and off and customize the line snapping in your drawings.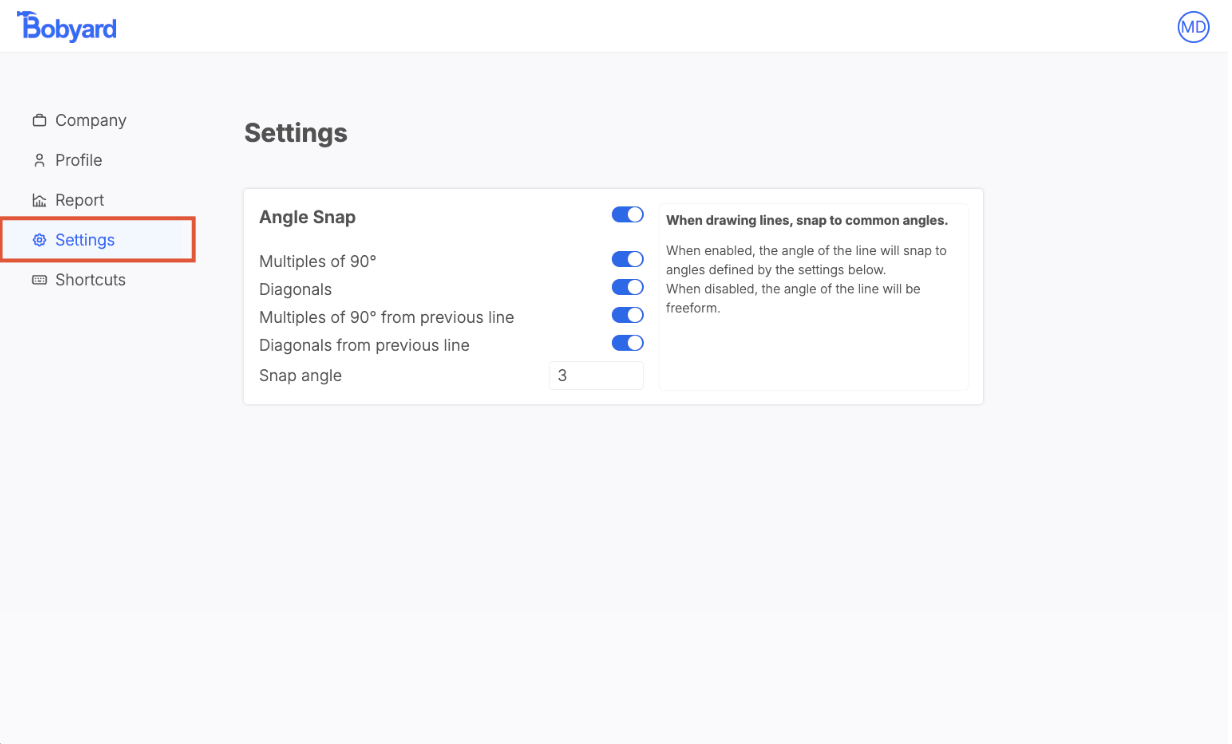
Angle Snap
When drawing lines, snap to common angles. Multiples of 90° The line will snap to 0°, 90°, 180°, and 270° relative to the screen. Diagonals The line will snap to 45°, 135°, 225°, and 315° relative to the screen. Multiples of 90° from previous line The line will snap to 0°, 90°, 180°, and 270° relative to the previous line that was just drawn. Diagonals from previous line The line will snap to 45°, 135°, 225°, and 315° relative to the previous line that was just drawn. Snap angle How many degrees away from the nearest angle the line will snap.Zoom sensitivity
This is a number before 0.01 and 0.95 for how sensitive the control + scroll zoom is. A higher number is more sensitive.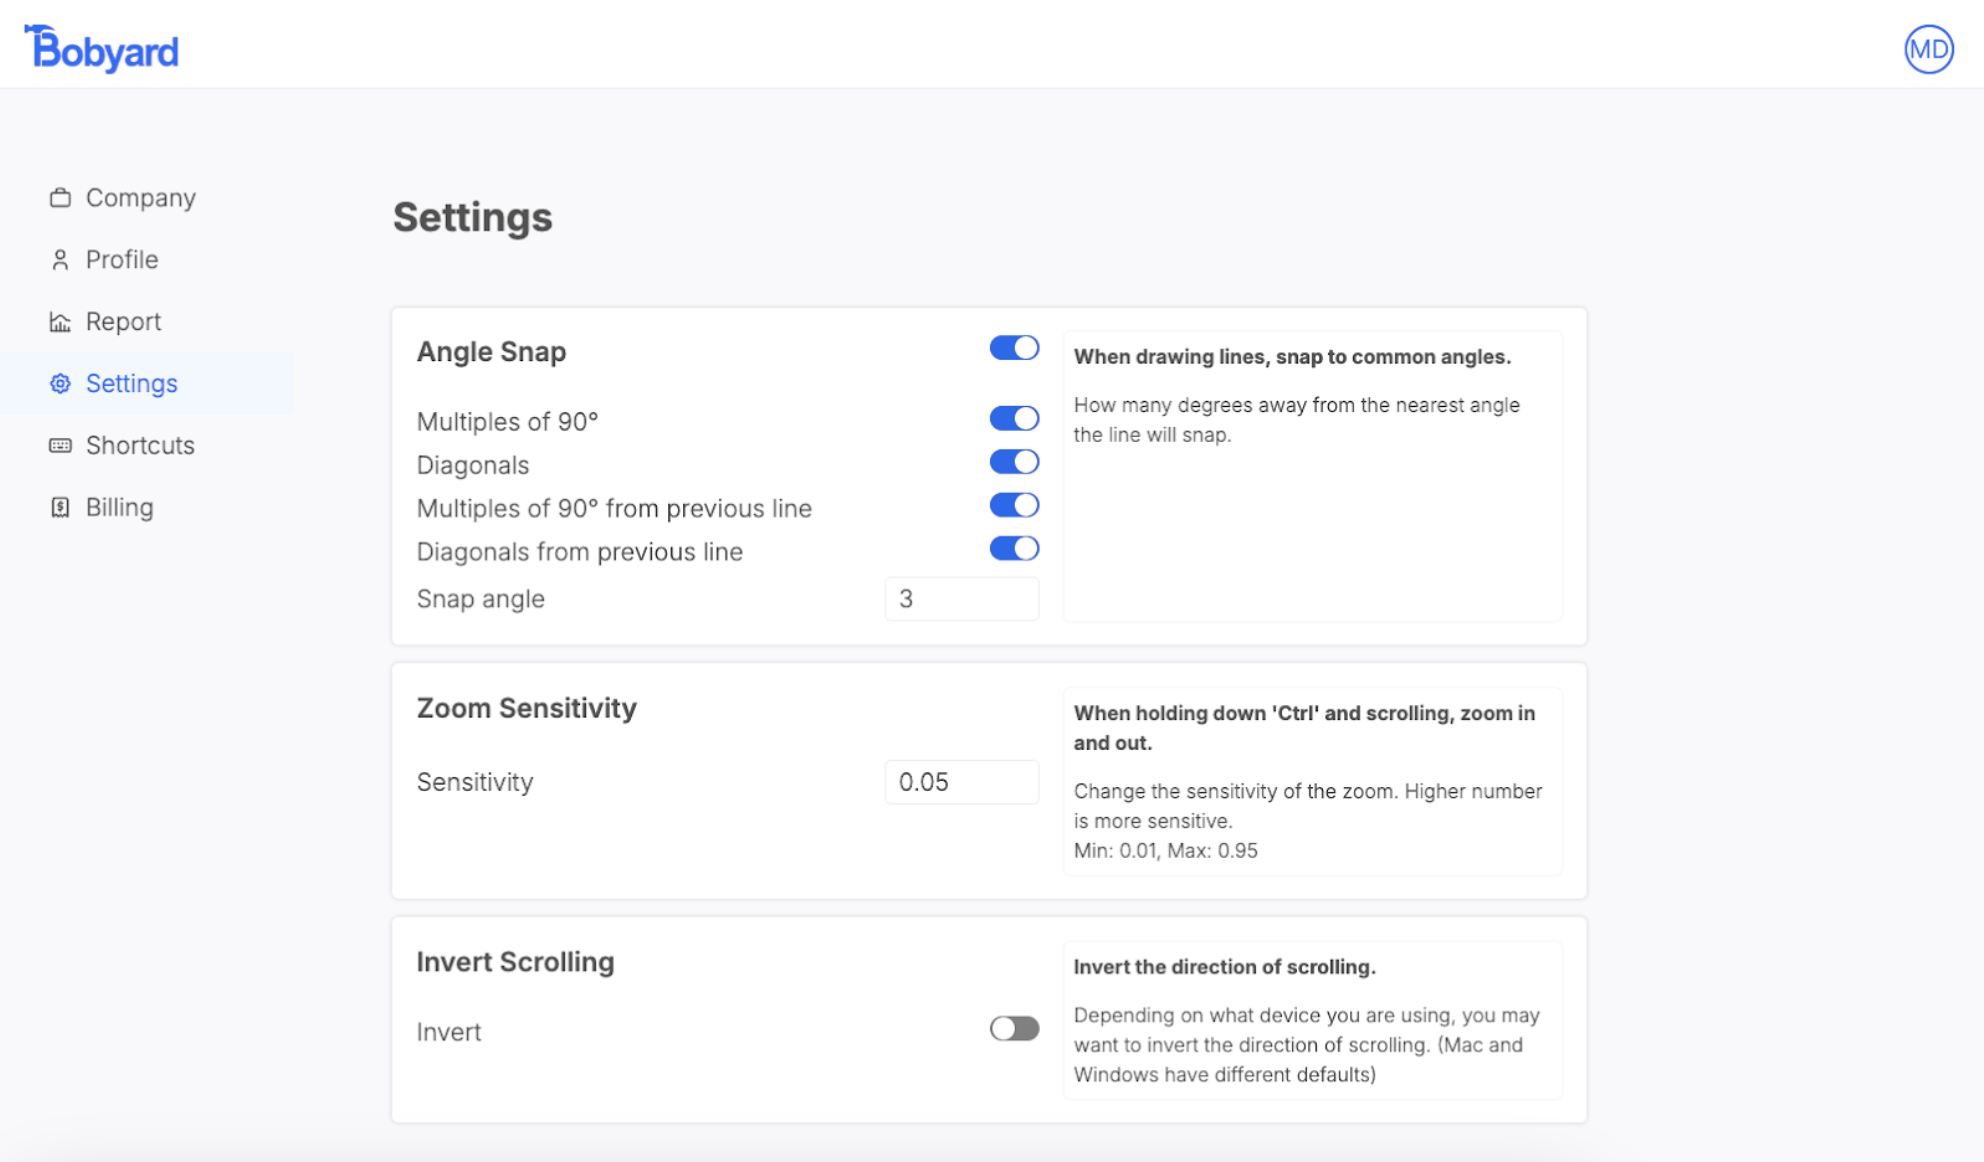
Invert Scrolling
Depending on what kind of device you have (Mac or windows), you may need to invert your scrolling. This impacts the follow actions on takeoff:- Scrolling up and down on the drawing
- Scrolling left and right on the drawing while holding down ‘shift’
- Zooming in and out on the drawing while holding down ‘control’
Takeoff keybinds
In the ‘shortcuts’ tab in the profile/settings pages, you can customize the primary and secondary keybind shortcuts for the takeoff page. The majority of the tools on the takeoff page have customizable shortcuts for ease of use.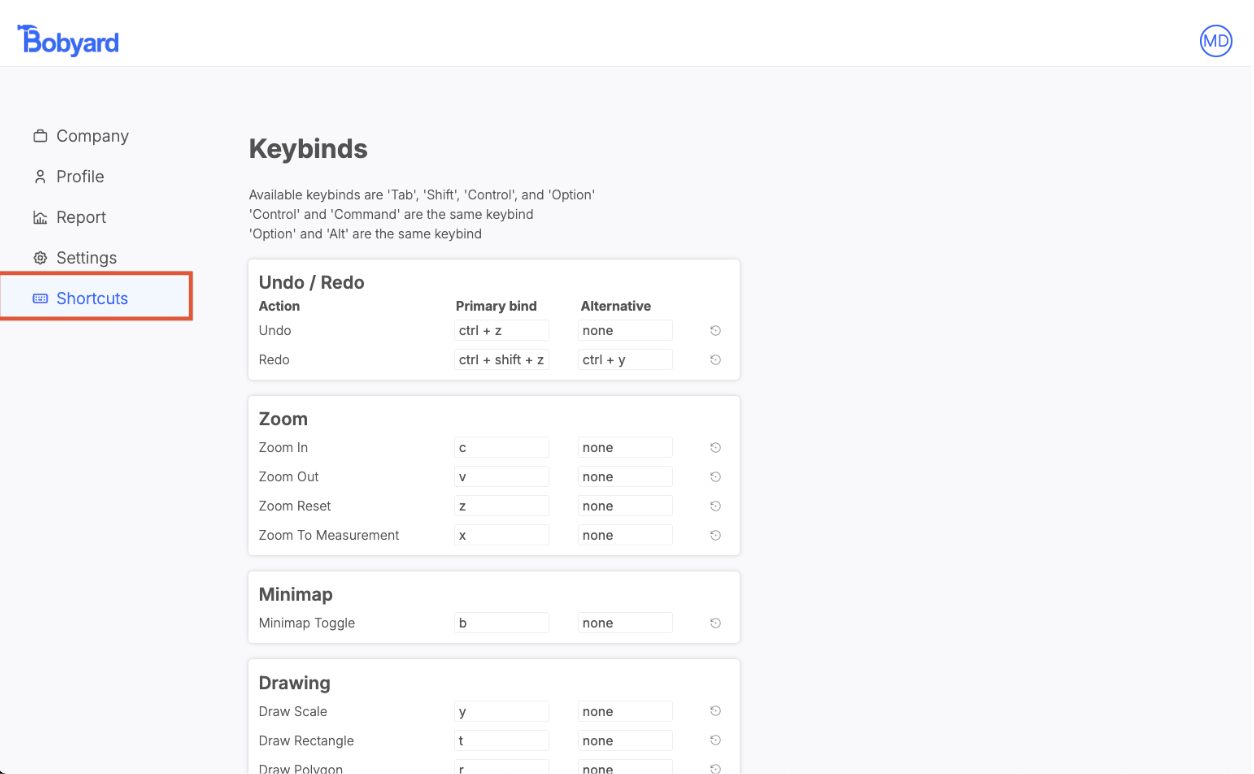
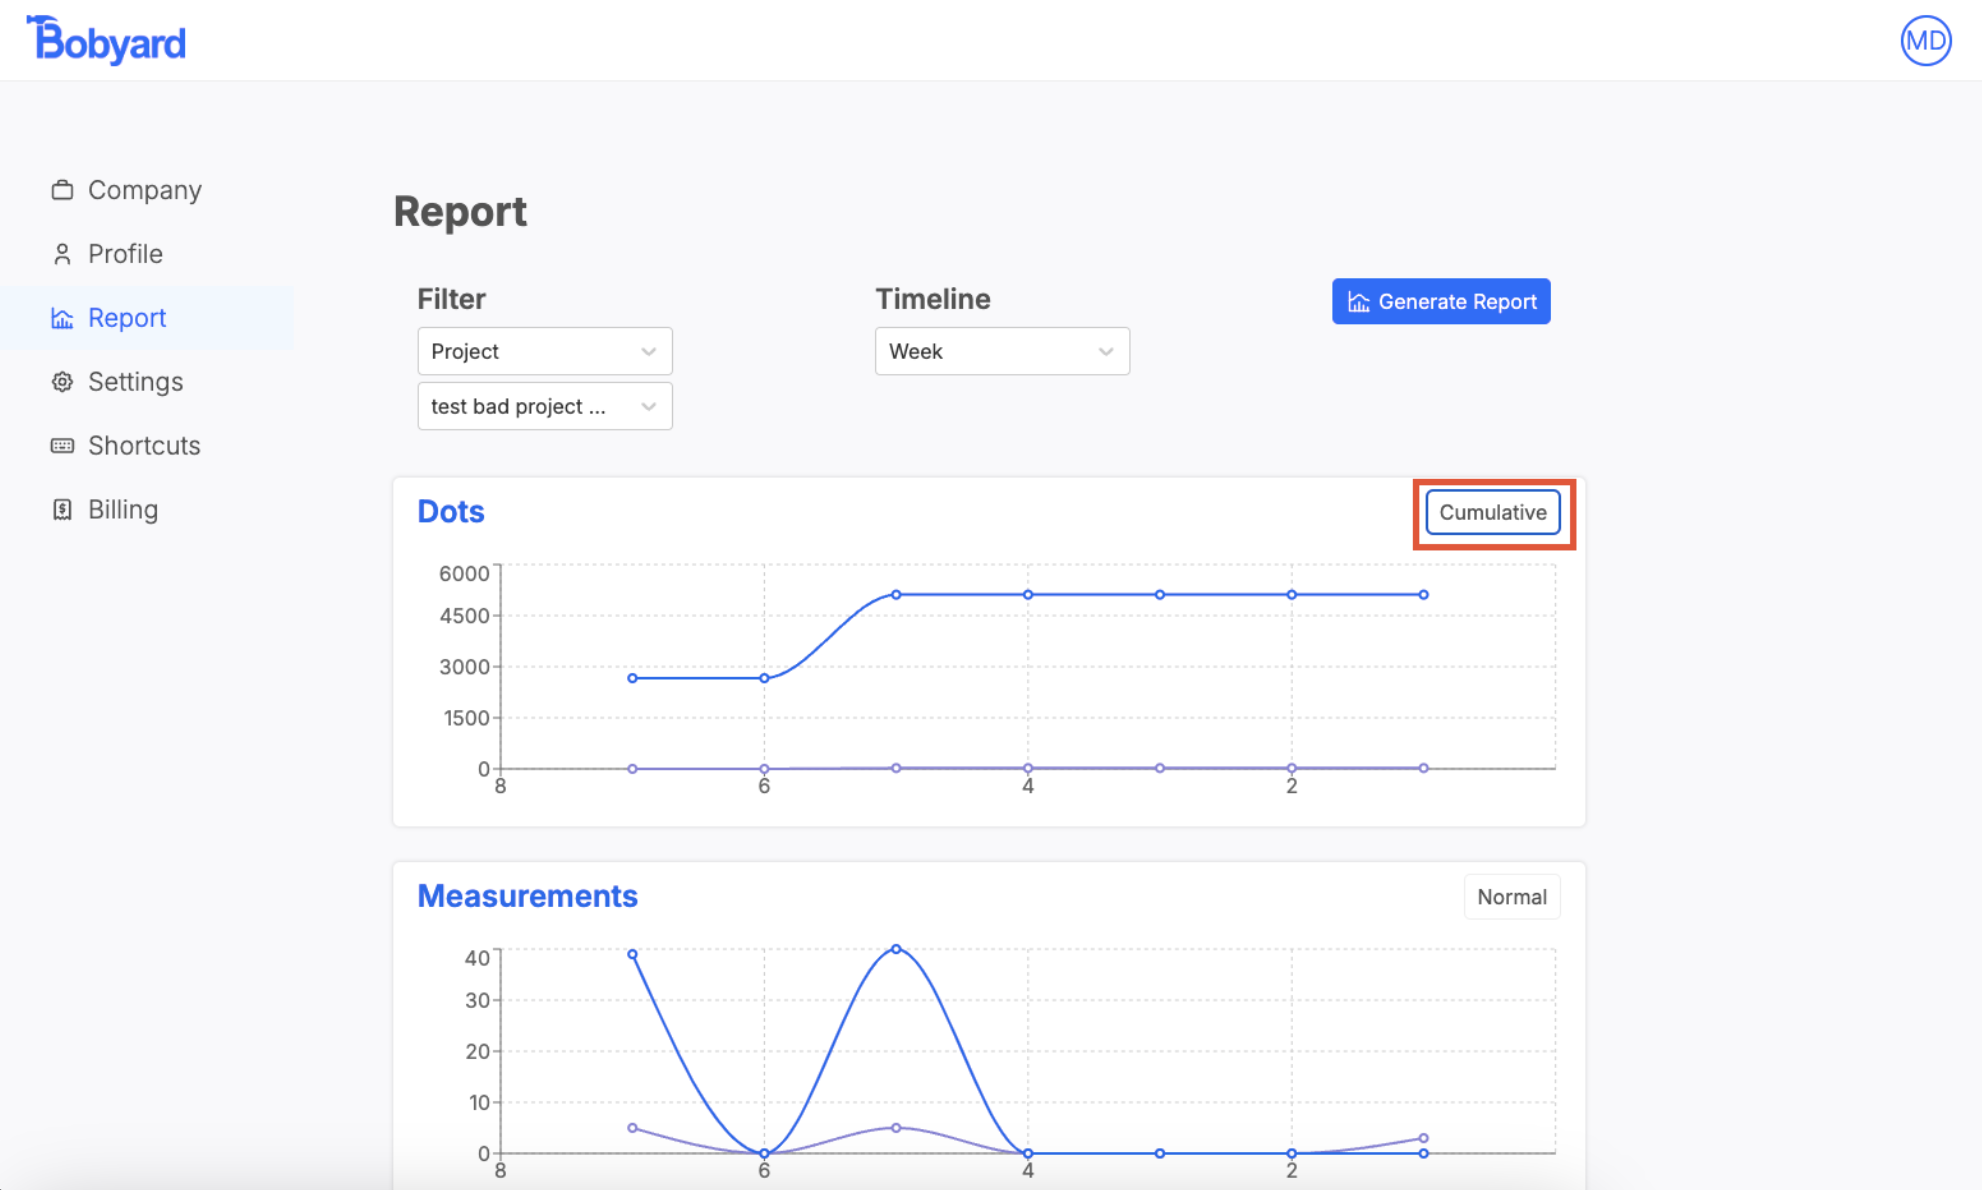
Report
In the ‘Report’ tab of the profile/settings pages, you can see a quick overview of the number of dots (counts), measurements and pages created.Filter
You can filter the results by the entire company, a specific project, or a specific user.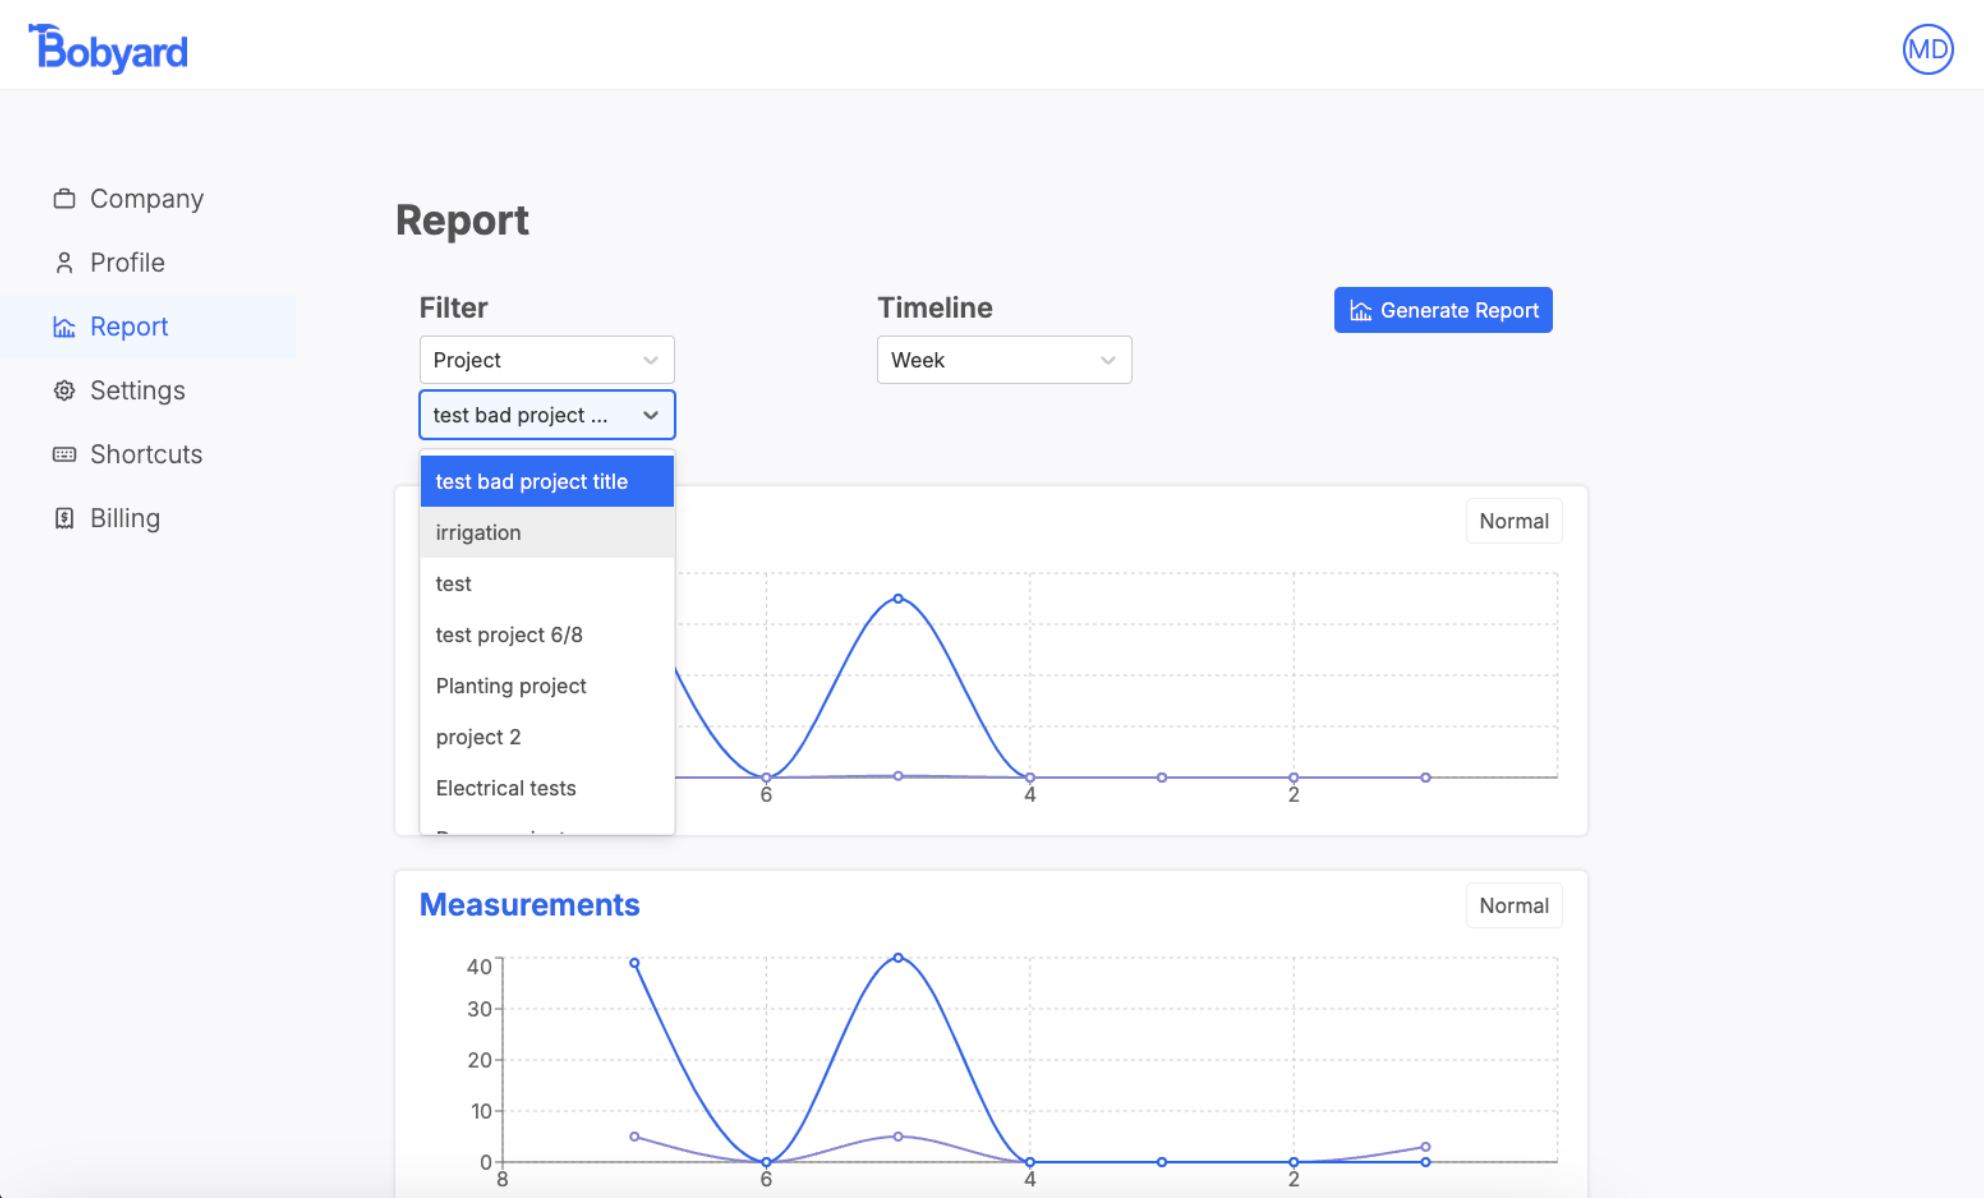
Timeline
You can compile results for the last day, week, month or year.Generate reports
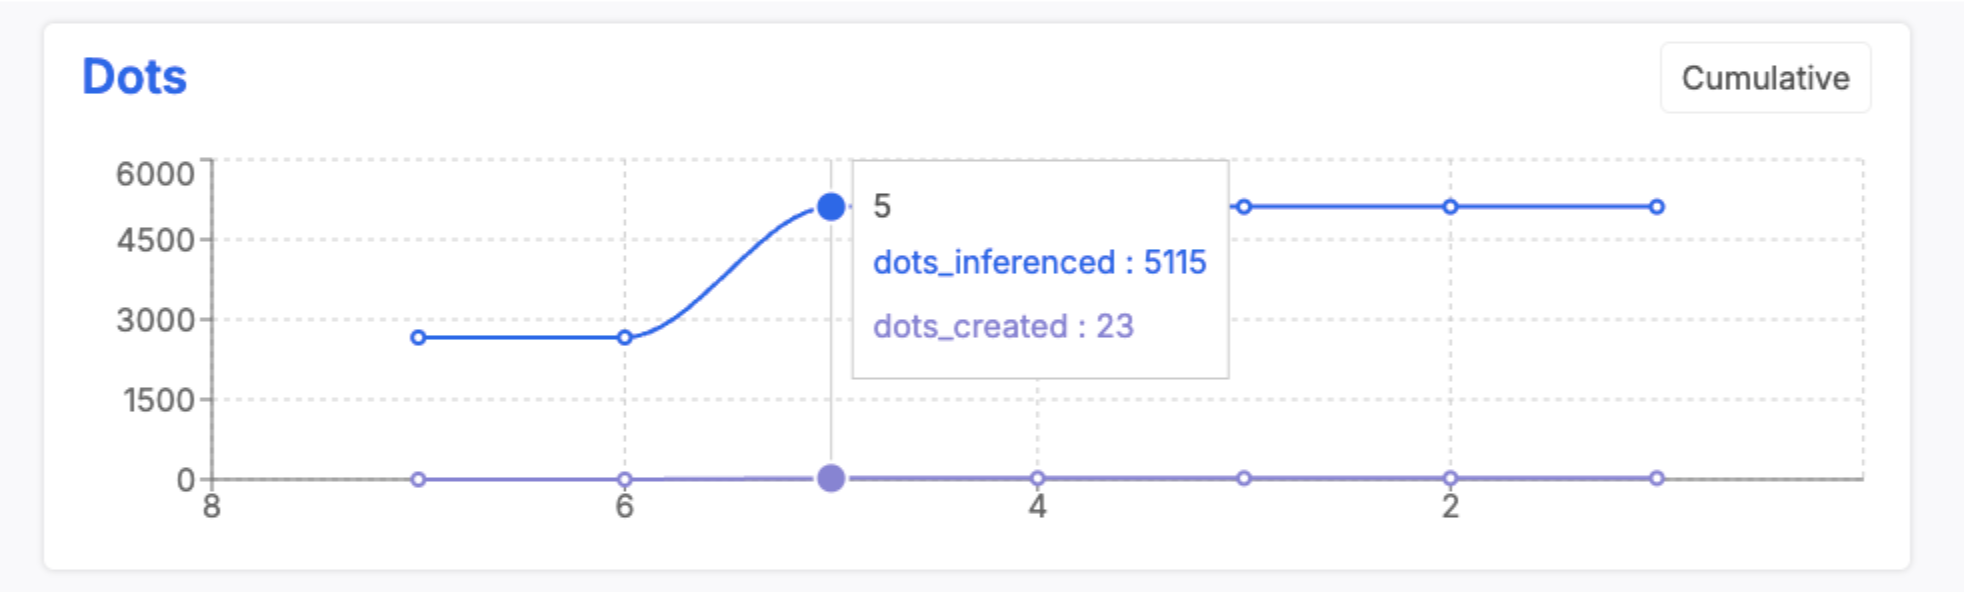
Once you have selected a filter and a timeline click on the blue generate report button. Once created, you will see three plots (dots, measurements, and pages) Clicking on the ‘Normal’/’Cumulative’ button will toggle the format of the graph.